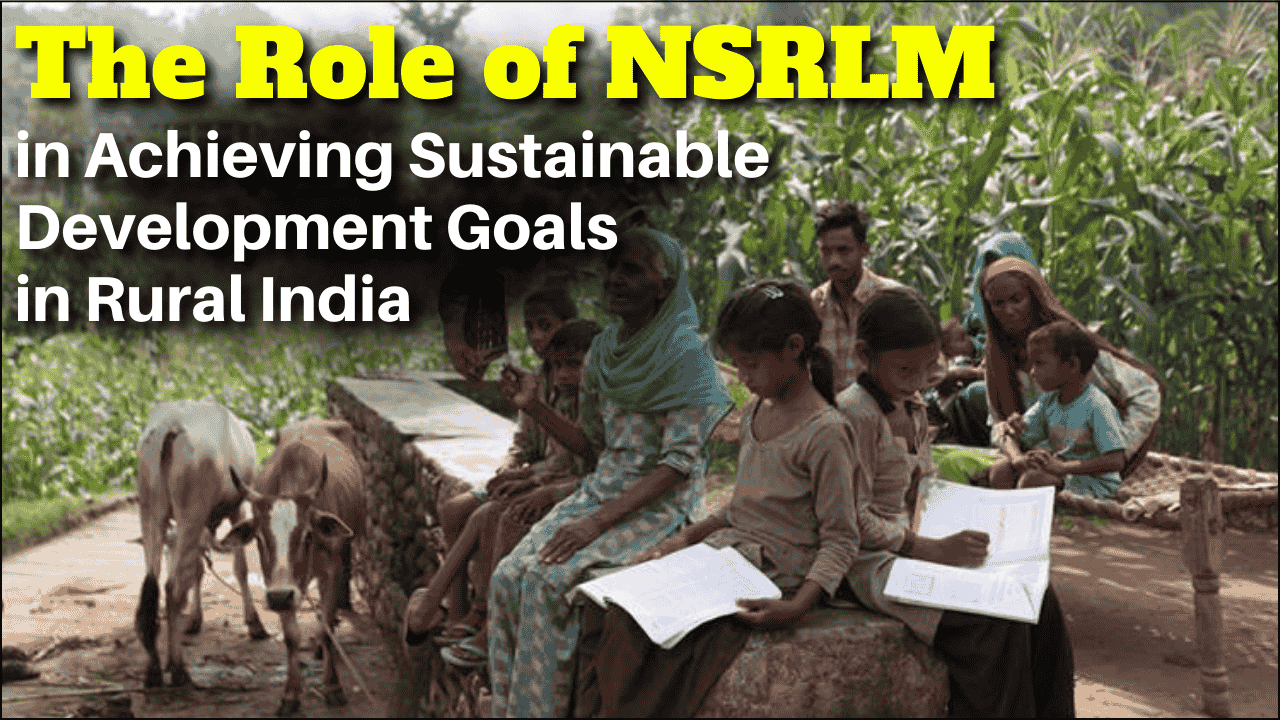
The Nagaland State Rural Livelihood Mission (NSRLM) has emerged as a transformative force in uplifting rural communities, particularly focusing on empowering women through sustainable livelihood opportunities. Based on research studies, this article explores the real impact of such programs on rural women across different economic dimensions.
Background of Rural Livelihood Missions
Rural livelihood missions in India evolved from earlier poverty relief schemes like the Integrated Rural Development Program (IRDP) and Swarnajayanti Grameen Swarojgar Yojana (SGSY). Recognizing the limitations of these programs, the government restructured them into the National Rural Livelihood Mission (NRLM) in 2010, later renamed as Deen Dayal Antyodaya Yojana-National Rural Livelihoods Mission (DAY-NRLM) in 2015.
The NSRLM, established in September 2012, serves as the implementing agency for NRLM in Nagaland. Its primary goal is to bring about sustained improvement in household incomes and overall well-being of rural communities through enhanced livelihood opportunities and improved access to financial services.
Income Generation and Economic Transformation
Research conducted in the Mon District of Nagaland reveals significant economic improvements among NSRLM beneficiaries compared to non-beneficiaries. The average annual household income of beneficiaries was substantially higher at R.131,719 compared to Rs.76,560 for non-beneficiaries.
The study found income diversification among beneficiaries with contributions from various sources:
| Income Source | Beneficiaries (%) | Non-Beneficiaries (%) |
|---|---|---|
| Other sources | 22.42 | 26.91 |
| Farming | 18.32 | 19.66 |
| Business | 18.20 | 18.29 |
| Wage/Salary | 12.20 | 11.69 |
| Livestock | 7.64 | 7.45 |
| NTFP | 7.48 | 3.79 |
| Timber/Firewood | 5.16 | 3.59 |
| Govt. Assistance | 4.66 | 6.60 |
| Weaving | 3.92 | 2.02 |
This diversification indicates that beneficiaries developed multiple income streams, reducing dependence on any single source and creating more resilient household economies.
Expenditure Patterns and Quality of Life
The increased income among beneficiaries translated to higher household expenditure (Rs.99,373 vs Rs.69,490 for non-beneficiaries), suggesting an improved quality of life. Importantly, the distribution of expenditure reveals changing priorities:
| Expenditure Category | Beneficiaries (%) | Non-Beneficiaries (%) |
|---|---|---|
| Food items | 41.69 | 52.58 |
| Children’s education | 28.85 | 27.64 |
| Social and religious | 5.84 | 3.27 |
| Clothing | 5.41 | 4.22 |
| Other | 4.19 | 1.67 |
| Health care | 3.73 | 2.84 |
| Transportation | 3.43 | 2.76 |
| Household materials | 3.07 | 1.02 |
| Fuel and electricity | 2.25 | 2.62 |
| Pan, tobacco, etc. | 1.54 | 1.38 |
While food remained the largest expense for both groups, beneficiaries spent proportionally less on food (41.69% vs 52.58%) and more on education, social activities, health care, and household improvements. This shift indicates progress beyond subsistence living toward enhanced social and human capital development.
Savings and Financial Security
Perhaps the most striking indicator of economic improvement was the dramatic increase in household savings capacity. Beneficiaries saved an average of Rs.32,346 annually compared to just Rs.7,070 for non-beneficiaries. This fourfold increase in savings provides a crucial financial buffer against emergencies and enables future investments in productive assets or education.
The return over expenditure ratio (income divided by expenditure) was also higher for beneficiaries across all landholding categories:
| Land Holding Category | Beneficiaries | Non-Beneficiaries |
|---|---|---|
| Marginal | 1.23 | 1.09 |
| Small | 1.31 | 1.10 |
| Semi-medium | 1.61 | – |
This indicates more efficient resource utilization and greater economic resilience among program participants.
Asset Creation and Livelihood Enhancement
The study measured six types of assets – human, physical, natural, social, financial, and food security – using standardized indices. Beneficiaries scored significantly higher across all asset categories:
| Asset Type | Beneficiaries (Mean Score) | Non-Beneficiaries (Mean Score) |
|---|---|---|
| Human assets | 65.7 | 37.5 |
| Physical assets | 53.9 | 36.6 |
| Natural assets | 63.7 | 54.8 |
| Social assets | 73.5 | 35.5 |
| Financial assets | 64.6 | 36.3 |
| Food security | 66.2 | 42.5 |
| Overall assets | 64.6 | 40.5 |
The most dramatic differences appeared in social assets (73.5 vs 35.5) and human assets (65.7 vs 37.5), highlighting the program’s success in building community networks and developing skills and knowledge.
Household Assets and Material Well-being
The increased income and savings translated into tangible improvements in material well-being. While essentials like housing and mobile phones were universal (100% ownership in both groups), beneficiaries showed higher ownership rates for items like:
- Television (25% vs 5%)
- Computers (12.2% vs 10%)
- Refrigerators (8.4% vs 5%)
- Sewing machines (13.4% vs 5%)
- Four-wheelers (8.4% vs 5%)
These assets not only improve quality of life but may also contribute to further income generation.
Factors Influencing Asset Creation
The study identified key variables associated with different types of asset creation among beneficiaries:
- Age showed a significant positive correlation with physical assets, financial assets, and overall asset creation
- Family type correlated positively with human asset creation
- Income levels strongly influenced human assets, financial assets, food security, and overall assets
- Expenditure patterns correlated with human assets, financial assets, and overall asset creation
These associations help program implementers understand which demographic and economic factors most influence successful outcomes.
Conclusion
The evidence demonstrates that rural livelihood missions like NSRLM are creating meaningful economic transformation in rural communities. By focusing on women’s participation through self-help groups, these programs deliver multidimensional benefits:
- Increased and diversified household income
- Improved expenditure patterns prioritizing education and development
- Substantially enhanced savings capacity
- Integral asset creation across human, social, financial, and physical dimensions
- Improved material well-being and quality of life
Most importantly, the data reveals that beneficiaries are moving beyond mere subsistence toward greater economic resilience and improved life chances for their families. The success of these interventions suggests that expanding such programs could further accelerate rural development and women’s economic empowerment across India.


